

 Facebook
 X
X
 Pinterest
 Copy Link
Springtown ISD Housing Market Report: Q2 2026 Prices, Inventory & Trends
If you’ve been keeping an eye on the local real estate market- whether you’re thinking about buying, selling, or just curious about what’s happening around us- the second quarter numbers for 2026 are in. As always, I like to share this data plainly and let it speak for itself. Numbers tell a more reliable story than headlines do, and I think our community deserves a clear, honest picture of where things stand.
This report looks at the Springtown Independent School District area, which covers a wider footprint than the city of Springtown itself. It’s a helpful view for anyone comparing homes both inside city limits and in the surrounding areas that feed into Springtown ISD. Data comes from the Greater Metro West Association of REALTORS®, based on the Texas REALTORS® Data Relevance Project.
Median Home Price
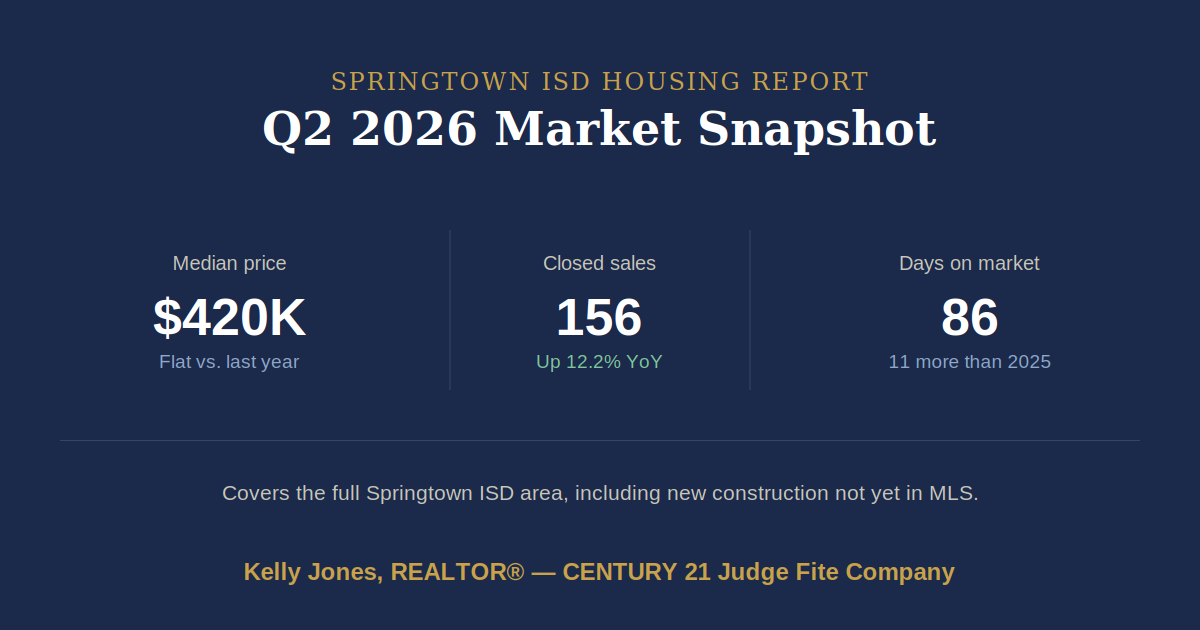
The median home price across the Springtown ISD area for Q2 2026 was $420,000, flat (0%) compared to the same quarter last year. Price distribution was spread fairly evenly across the middle of the market: 20.5% of homes sold between $200,000–$299,999, 21.2% between $300,000–$399,999, 26.3% between $400,000–$499,999, and 23.1% between $500,000–$749,999. Smaller shares landed at $100,000–$199,999 (5.8%) and $750,000–$999,999 (3.2%).
Active Listings and Closed Sales
Active listings were up 4.7% year-over-year, with 247 homes on the market during the quarter. Closed sales were up 12.2%, with 156 homes sold. More homes available and more homes selling both point to a district-wide area that’s staying active.
Days on Market
Homes across the Springtown ISD area spent an average of 86 days on the market before going under contract, plus another 37 days to close- a total of 123 days from list to close. That’s 5 days more than the same quarter in 2025, a modest shift rather than a dramatic one.
Months of Inventory
Months of inventory sits at 6.0, up slightly from 5.5 in Q2 2025. This is a gentle move toward more balance between buyers and sellers, though still within a fairly steady range.
A Note on New Construction
It’s also worth pointing out that this report is based on MLS data, and there’s a significant amount of new construction happening throughout the Springtown ISD area that isn’t captured here. Many builders sell directly, off-market, or through their own on-site sales offices rather than listing in the MLS. That means the real volume of homes being built and sold in our area is very likely higher than these numbers alone show- something worth keeping in mind if you’re trying to get a full picture of local growth and inventory.
What This Means
Every quarter tells a slightly different story, and comparing the city of Springtown to the broader ISD area can highlight different trends depending on which boundary you’re looking at. This quarter, the ISD-wide numbers point to a market that’s holding fairly steady on price while staying active on both the buying and selling side.
As always, if you have questions about what these numbers mean for your specific situation- whether you’re considering a move, curious about your home’s value, or just want to talk through the local market- I’m always happy to chat. As a Springtown resident myself, I love keeping our community informed with real, straightforward data.
Source: Texas REALTORS® Data Relevance Project, in partnership with local REALTOR® associations and the Real Estate Center at Texas A&M University. Data provided by the Greater Metro West Association of REALTORS®.
Kelly Jones / Real Estate Professional
Century 21 Judge Fite Co.
Call or text me: 832-681-0445
Email: keyswithkellyjones@gmail.com


